2024. 1. 12. 18:37ㆍStatistics
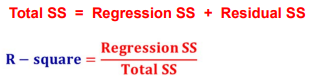
R-square
- Increasing the number of X-variables, increases R-square.
- Varies from 0 to 1
- Proportion of variation in the Y variable explained by the regression model.
- Values closer to 1 indicate a good fit.
‘Overall’ variation in Y variable : ‘Total’ Sum of Squares
‘Explained’ variation in Y variable : ‘Regression’ Sum of Squares
‘Unexplained’ variation in Y variable : ‘Residual’ Sum of Squares

The regression model can explain about 47.45% variation in the House Prices.
The remaining variation goes unexplained.
Adjusted R-square
Mere addition of X variables always increases R-square.
Adj. R-square adjusts the R-square for the number of X variables in the model.
Better to use the Adj. R-square.
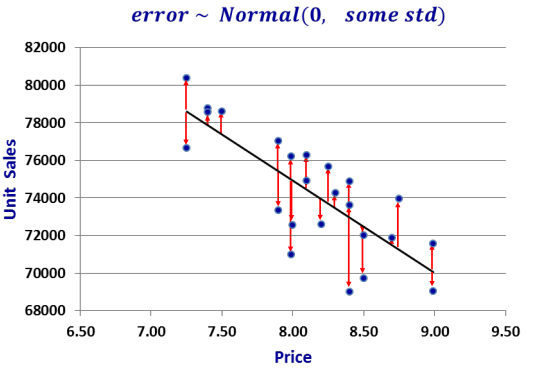
Importance of the Normality assumption about errors
- Errors are equally distributed with the mean of zero (constant std).
'Statistics' 카테고리의 다른 글
| Hypothesis Testing in a Linear Regression (0) | 2024.01.13 |
|---|---|
| Residual degree of freedom (0) | 2024.01.13 |
| 카이제곱검정 (0) | 2024.01.11 |
| 평균, 분산, 표준편차 (0) | 2024.01.11 |
| 변량, 도수, 상대도수, 도수분포표, 히스토그램 (0) | 2024.01.11 |